Start with the slow page and the task people are trying to complete. Save a baseline, identify the main delay, make a bounded change and measure again under the same conditions. The work should improve the actual visit, not just remove warnings from a report.
Why speed affects your rankings
Search visibility is one reason to improve speed; usability is another. Loading, interaction response and layout stability describe different problems, so one overall score cannot replace diagnosis. A PageSpeed Insights report may contain both field and lab data. Keep those results separate, and read the business impact of speed before assigning a revenue figure to a technical change.
There is no fixed percentage by which conversions drop for every extra second of load time. Measure completed enquiries or purchases before and after a change, accounting for the audience and offer. A loading delay can be a problem without proving a particular revenue loss.
The biggest speed killers
Check the largest visible content first. Its image should be discoverable early, correctly sized and encoded at an acceptable visual quality. Do not lazy-load an image that is needed immediately. Defer off-screen media, but check that it is ready as the visitor reaches it.
Then inspect JavaScript tasks and competing downloads. Optional widgets need not run before the visitor uses them. Fonts should cover the languages and weights actually displayed. Compression savings vary by asset, so compare the files and inspect the result.
Caching rules should distinguish versioned public assets from personal or frequently changing responses. Measure cold and repeat visits. Google's LCP guide explains how server wait, discovery, download and render delay contribute.
The Network panel in Chrome DevTools shows which files load, how long requests take and their order in a waterfall. Use that evidence to distinguish server waiting from a large download. The Performance panel helps investigate long browser tasks; a Lighthouse score alone does not identify every cause.
The WordPress speed problem
A platform name does not determine a performance result. Review the theme, extensions, templates, hosting response and assets of the actual site. Check dependencies before removing a plugin; it may own forms, checkout or content. Test changes on a preview and retain a rollback. A coded rebuild is one option, not an automatic cure for a problem that has not been measured.
What a speed fix actually looks like
For Version2's own site, a technical review found that the image cache could not write its files even though the application health check passed. The repair was verified by checking a repeated image request, not by assuming that a healthy server meant caching worked. This is a useful testing pattern: identify the failure, verify the changed behavior, then measure the page. It is not evidence of a particular conversion or ranking gain.
Quick wins you can do today
- Save a baseline for the page and a representative mobile visit.
- Identify whether the main delay is server response, download or browser work.
- Make one focused change and check the affected functionality.
- Repeat several runs with the same device and network settings.
- Inspect the released site as well as the preview.
- Compare real-user data when enough observations are available.
Keep clear records of the environment and release. A fast local preview is not a production measurement.
How fast is fast enough?
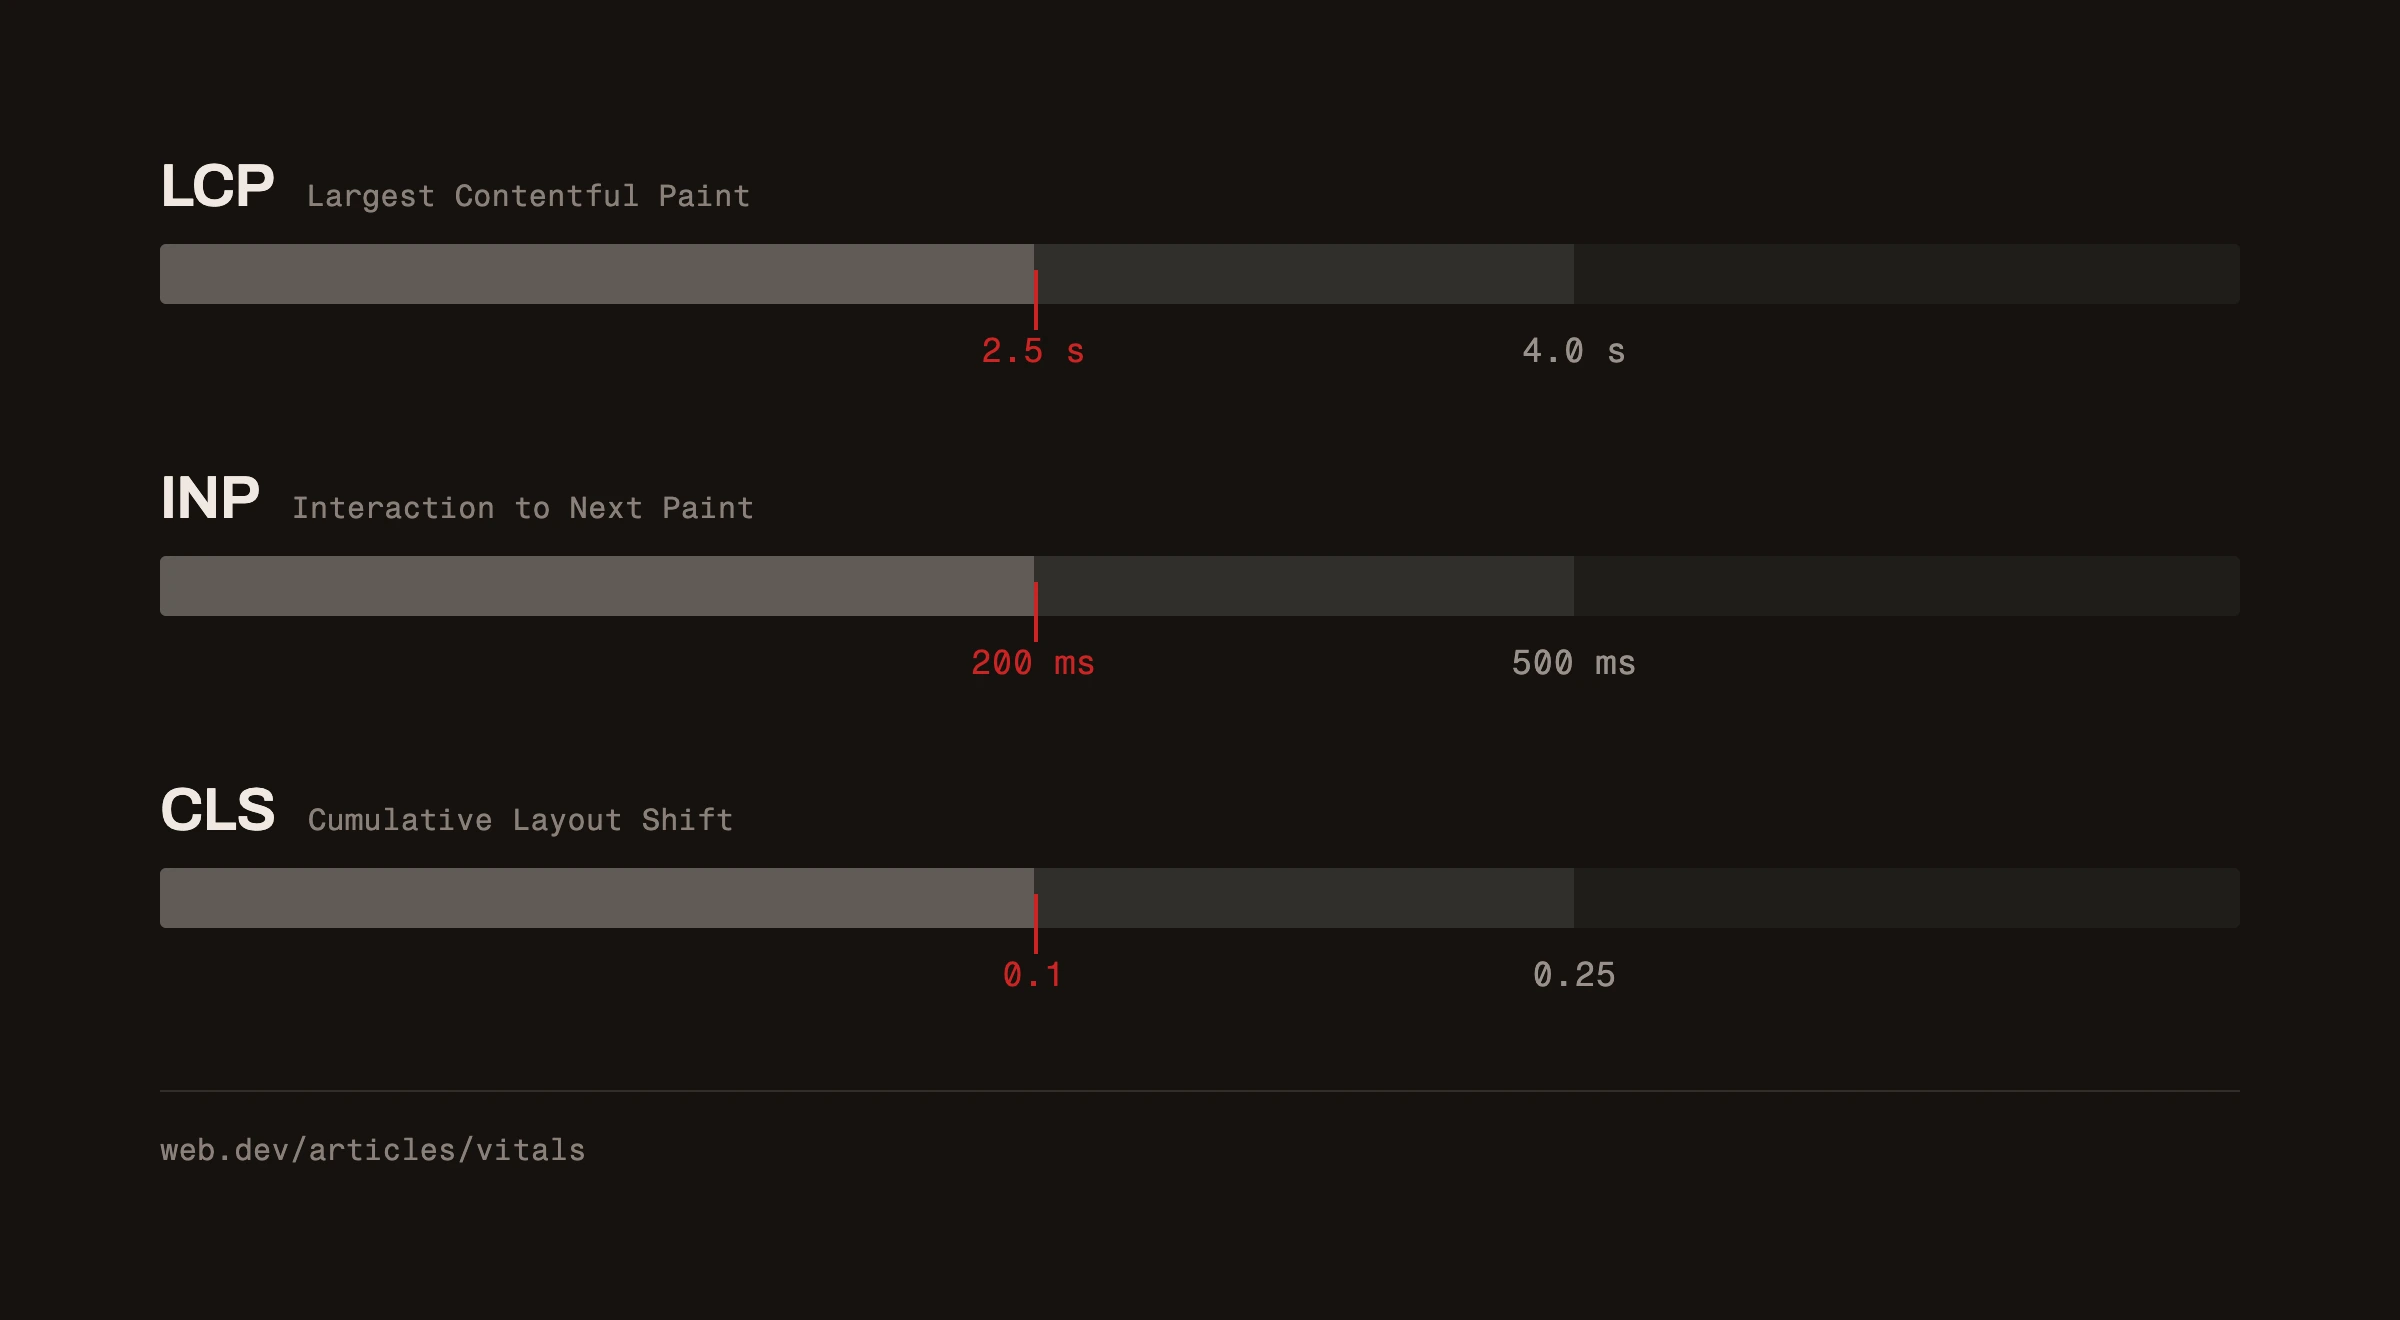
The current Core Web Vitals targets are LCP at most 2.5 seconds, INP at most 200 milliseconds and CLS at most 0.1 at the 75th percentile. A Lighthouse run cannot establish every field metric. Also test the form, navigation and checkout a visitor actually uses. For a site-specific starting point, request a free website analysis or discuss the work through our web-development service.